Hi everyone,
As a previous Firebase user and new Sentry lover, my analysis may suffer from a bias but I need to bring two related topics on the table.
1/ Events displayed vs. Charts
One of my issue has the following frequency histogram :

When I try to navigate through the different events of my issue with OLDER / NEWER options, I only have details about 2 events from the last hour instead of 4 (cf picture)
Any idea ?
2/ Filtering and detailed issues : Feature Request
I use Sentry to link ReactNative issues to crash scenarios from my users. Let’s say I filter the issues by app device. When I want to go deeper and find the specific event of this issue, the filter no longer persists and I have events from all devices.
This filter identifies issues and not events, I understand, but it’s not intuitive and easy-to-use for my needs.
3/ Filtering with age:-Xm feature
I use this feature when the QA team makes the app crash to look for the issue into the most recent ones.
But here is the problem : https://imagizer.imageshack.us/v2/540x298q90/923/I4HNfR.png
This is a screenshot with the last three issues that occured within the last 10 minutes. But as soons as I use a age:-1h filter, I have only one result : https://imagizer.imageshack.us/v2/836x213q90/924/9bFqFu.png
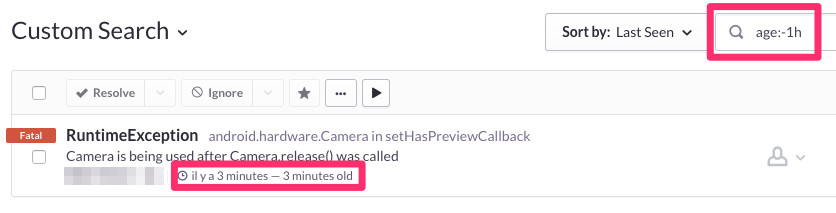
Any idea why the two other issues are not displayed ?